
Introduction: Parameter Actions in Tableau
synvert TCM (formerly Crimson Macaw) was recently working with a client to convert an existing Excel spreadsheet to a Tableau dashboard. One of the requirements was to filter values in a table by clicking an aggregated measure value from a separate table. To do this we used parameter actions in Tableau.
The below shows what the client wanted to achieve. The top table shows various aggregated measures, that when clicked, would filter the lower table of data. For example, to see what states have errors related to sales, clicking “19” would filter to the 19 affected states.
The client originally achieved this using Excel filters. The below shows a very similar example to the clients. Not only can we replicate this functionality, but we can also achieve it with fewer clicks overall!
Previously filtering like this wouldn’t have been feasible in Tableau. It was Parameter Actions, a feature introduced in Tableau 2019.2, that made meeting this requirement possible.
Components
To achieve the filtering feature in Tableau in this example we need:
| Component | Function | Number Required |
|---|---|---|
| Parameters | To hold values passed from the Parameter Actions | We need one to pass the measure category e.g. Sales and another to pass the variation e.g. States with No Errors |
| Parameter Actions | To update Parameter values related to the measure selected | For this we need to multiply the number of parameters we have by the number of measure variations, in this scenario we have 2. 2×2 = 4. |
| Parameter Actions | For the “Clear” button | 2 required to reset each Parameter back to default |
| Calculate Field | To create a hardcoded label to pass to the Parameters for the reset button | 1 required |
| Calculate Field | A calculation that we can add to the filter section of the second table to produce the filtered results | 1 required |
The flow of execution will follow like this:
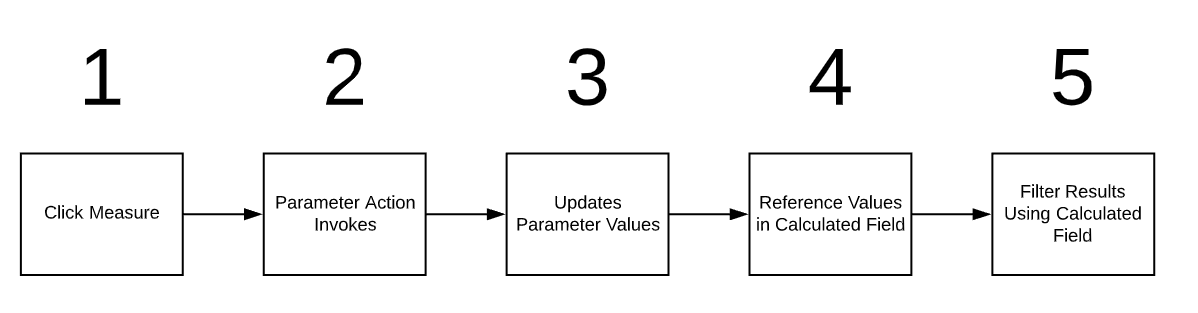
Data Tables
Bottom Table
The workbook created for this blog used the Tableau Sample – Superstore dataset.
Using the Sales, Profit and Discount fields in the data we created boolean indicators to determine if each state met a predefined condition. These Booleans were placed on the shapes pill and represented as “X” for error and “✓”” for no error.
Example of the sales boolean calculation called [Sales Ind]:
IF SUM([Sales]) > 1000 THEN True
ELSE False
END
Top Table
The numbers in this table represent a count of each status in the bottom table. This table is comprised of two worksheets; one sheet contains the 3 measures for “Errors” and the other sheet contains the 3 measures for “No Errors”.
An example of “Sales” for “States with No Errors” called [Sales > 1000 Count]. We use a FIXED calculation, as we want to rationalise the result only at the [State] level.
{ FIXED [State]:
IF [Sales Ind] = True THEN 1
ELSE 0
END}
How to Recreate
Create the Parameters and Parameter Actions
1) Create two parameters. In the Create Parameter box, do the following and click OK.
- Name the parameter. In this example, the first parameter is named [Filter Label] and the second is [Filter Measure]
- For the Data Type select String
- For Allowable Values, select All
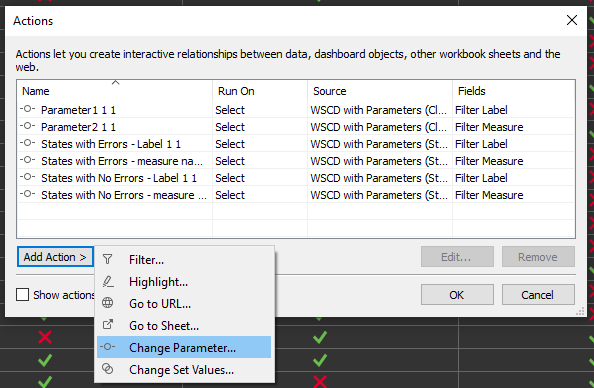
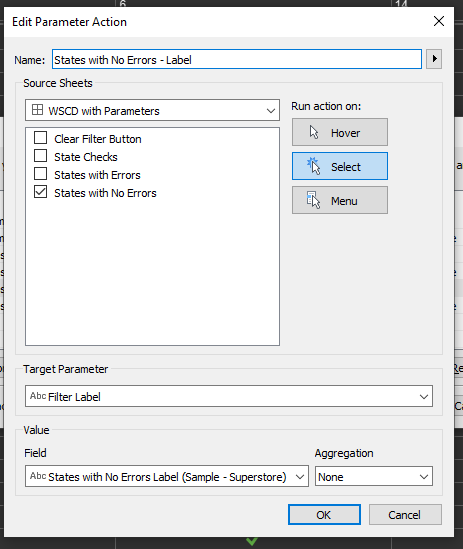
2) Create 4 actions for the dashboard. In the Action dialog box, select Add Action > Change Parameter.
- Action 1:
- Name the Parameter Action [States with No Errors – Label]
- Choose the sheet or data source. For this example, States with No Errors on Dashboard 1 is used
- For the Run action on choose Select
- The Target Parameter is the first parameter, Filter Label
- For the Field select States with No Errors Label. This is the label created via a calculated field and used in the Rows shelf.
- Aggregation is left as None
- Click OK
Repeat the above the other actions required
- Action 2:
- Name the Parameter Action [States with No Errors – measure names]
- Sheet is States with No Errors on Dashboard 1
- For the Run action on choose Select
- Then for the Target Parameter select Filter Measure
- For the Field select Measure Names
- Aggregation is None
- Click OK
- Action 3:
- Name the Parameter Action [States with Errors – Label]
- Select the States with Errors sheet for the Source Sheet
- For Run action on choose Select
- Then Target parameter select Filter Label
- For the Field choose States with Errors Label
- Aggregation is None
- Click OK
- Action 4:
- Name the Parameter Action [States with Errors – measure names]
- Select the States with Errors sheet for the Source Sheet
- For Run action on choose Select
- Then Target parameter select Filter Measure
- For the Field choose Measure Names
- Aggregation is None
- Click OK
Now each time a measure is selected in the top table, we will see the Parameter values updated:
Create a calculation that can filter the bottom table
The essence of this calculation is to return the State name when it fits in the category of the measure that was clicked. When the State does not meet the criteria of the selected measure then we wish to return a NULL value. We can then use the field to always exclude NULL values in the filter of the bottom table.
IF [Filter Label] = 'Clear Filter'
AND [Filter Measure] = 'Clear Filter'
THEN MAX([State])
ELSE
IF [Filter Label] = 'States with No Errors'
AND [Filter Measure] = 'Sales'
THEN
CASE [Sales Ind]
WHEN True THEN MAX([State])
ELSE 'Null'
END ELSEIF [Filter Label] = 'States with No Errors'
AND [Filter Measure] = 'Profit'
THEN
CASE [Positive profit find]
WHEN True THEN MAX([State])
ELSE 'Null' END
ELSEIF [Filter Label] = 'States with No Errors'
AND [Filter Measure] = 'Discount?'
THEN
CASE [Discount? Ind]
WHEN True THEN MAX([State])
ELSE 'Null' END
ELSEIF [Filter Label] = 'States with Errors'
AND [Filter Measure] = 'Sales < 1000 Count'
THEN
CASE [Sales Ind]
WHEN False THEN MAX([State])
ELSE 'Null'
END
ELSEIF [Filter Label] = 'States with Errors'
AND [Filter Measure] = 'Negative Profit Count'
THEN
CASE [Positive profit find]
WHEN False THEN MAX([State])
ELSE 'Null' END
ELSEIF [Filter Label] = 'States with Errors'
AND [Filter Measure] = 'Discount Not Applied Count'
THEN
CASE [Discount? Ind]
WHEN False THEN MAX([State])
ELSE 'Null' END
ELSE 'Null'
END
END
The below shows the calculation above, next to the State column. Notice how the values interchange between NULL and State names based on the measure selected. In addition, we can now add this field to the filter section of the bottom table to always exclude NULL.
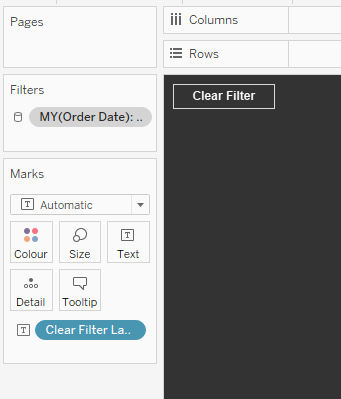
Create a Clear Filter button
Action Parameters don’t automatically return to default when you deselect the value that filters the dashboard. Therefore, a button needs to be created to reset the dashboard.
- Create a new sheet
- Create a Calculated Field named [Clear Filter Label]
- In the formula field, create a calculated field like the following:
'Clear Filter'
- Place the Clear Filter Label Dimension in the text box on the Marks card
- Format suitably and place in the dashboard.
4) For the Clear Filter button to work two more parameter actions must be created.
- Action 5:
- Name the Parameter Action [Clear Filter – Label]
- Sheet is Clear Filter Button
- For Run action on choose Select
- When Target Parameter select Filter label
- For the Field select Clear Filter Label
- Aggregation is None
- Click OK
- Action 6:
- Name the Parameter Action [Clear Filter – Measure Names]
- Source Sheet is the Clear Filter Button
- Then Run action on choose Select
- The Target Parameter is Filter Measure
- For the Field select Clear Filter Label
- Aggregation is None
If you refer back to the Calculation used to drive the filter of the bottom table, you can see the reference to the Clear Filter values at the top of the calculation. When Clear Filter is selected, then all State names will be returned in the filter.
IF [Filter Label] = 'Clear Filter'
AND [Filter Measure] = 'Clear Filter'
THEN MAX([State])
ELSE
.........(cont.)
Conclusion: Parameter Actions in Tableau
As you can see Parameter Actions can be utilised to implement powerful dashboard functionality. This is just one example of a pretty niche requirement, I’m sure there will be many use cases in your organisation where Parameter Actions can really add value.
Want to know more? Need help with your own data journey? Get in touch here.