
By Stuart Lambert – Senior BI Engineer
Introduction
At synvert TCM, we’ve been working with a client in the defence industry. Our job was to provide a global reporting and analytics platform. The platform is based on dimensional modelling (Wikipedia, Kimball). This platform has unlocked previously unavailable insights from their Enterprise Resource Planning (ERP) data across their entire organisation. In this article, we’ll look at some of the challenges overcome to achieve this.
Architecture
In this solution, Snowflake, Fivetran, dbt, and Power BI have been used to implement an analytics and reporting platform with a data-lakehouse-like architecture (P. Menon, “Data Lakehouse in Action”, Packt, 2022).
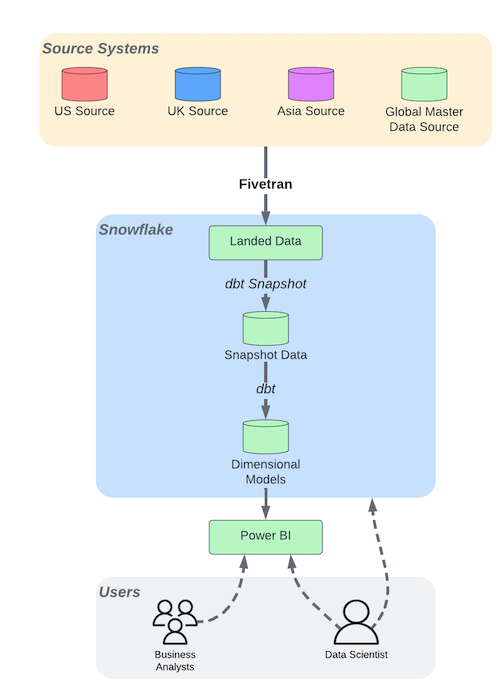
Fivetran has been used to copy the source system data into a landing area in Snowflake. dbt was then used to capture changes in the data in Type II slowly changing dimension format. We did this using the snapshot functionality (volatility and cost considerations made using change data capture data unfeasible). dbt was then used to orchestrate the transformation of the snapshot data into dimensional models to be used in analytics and reporting.
Power BI has been selected as the visualisation tool to provide business analysts with access to pre-generated visualisations and dashboards. It also gives them the flexibility to create their own visualisations using data sets built from the dimensional models in Snowflake. More advanced analysts or data scientists may be given access to the data in Snowflake to query directly.
Challenges
Security
The Challenge
As a member of the defence industry, a key consideration in building this platform was ITAR-related restrictions. This places heavy restrictions on preventing those without approved access from accessing or viewing sensitive data. It also impacts how the data can be stored and shared.
Our client requires their data to be on a highly performant and globally accessible platform. Their data also need to be stored securely with robust controls limiting who can access sensitive data.
The Solution
Our client chose Snowflake to host their data warehouse. Being a cloud technology, Snowflake has high performance and is easily accessible with many security features such as encryption and MFA. They were able to choose US-based servers. While this may present some latency issues for users in other areas, it prevents potentially sensitive data from being exported and stored outside of the United States, complying with ITAR requirements.
Snowflake also has strong user access management with role-based privilege assignment. Using roles, access to specific databases, schemas or tables can be restricted so users only have access to the data that they need and are authorised to view.
Row-level security can also be applied so that, for instance, UK-based analysts can only query records in tables related to data from UK-based systems. For global analyses, column-level security may be applied so any potentially sensitive data can be hidden from view without limiting the volume of data available.
| US View | UK View | |||
|---|---|---|---|---|
| System | Value | System | Value | |
| UK | A | UK | A | |
| UK | B | UK | B | |
| UK | C | UK | C | |
| US | A | |||
| US | B |
| US View | UK View | |||
|---|---|---|---|---|
| Sytem | Value | System | Value | |
| UK | A | UK | A | |
| UK | B | UK | B | |
| UK | C | UK | C | |
| US | A | US | !! Redacted !! | |
| US | B | US | !! Redacted !! |
Different Sites
The greatest challenge in implementing a global analytics and reporting platform is that our client is a global company. Their data is being collated from multiple sites across the world.
Different Source Systems
The Challenge
Transforming data into a format optimised for reporting and analytics can be a challenge in itself. It requires understanding the business processes being modelled and where the data should be sourced from. You also need to know how to deal with data quality issues, how to manage and implement master data from custom sources and how the business has used its system in “creative” ways to meet its requirements.
But for a global corporation, the complexity grows significantly.
Different sites may store their data in different ERP systems resulting in different business processes. This makes some data requirements in one location simply non-existent in another location. Even when different sites use the same ERP, the implementation of the ERP may be different with differing customisations. Or, for historic reasons, for example, the business processes may differ slightly, translating as differences in how the ERP is used and how they store data.
These different ERP systems, different implementations, or different processes mean that in some cases, no two sites do things in the same way. This creates conflicts that make transforming data into a consistent global view challenging.
The Solution
The most important action taken was business process mapping. When developing a dimensional model for reporting, a fact table represents a single business process (C. Adamson, “Star Schema: The Complete Reference”, McGraw Hill, 2010) and by mapping the process the business users can confirm the process and ensure that only one process is being modelled at a time. Across the different environments, the business process maps were compared to identify similarities where reporting can be done consistently or differences where concessions or “adaptations” must be made.
Following business process mapping, sun modelling helped identify the data required in the final global dimensional model.
In both Kimble and Inmon data warehouse architectures, different source systems are integrated as the data is added to the warehouse. This differs from the data-lakehouse-like architecture implemented (shown below in more detail). The data from each source system has been kept separate until its transformed into the desired dimensions and fact tables.
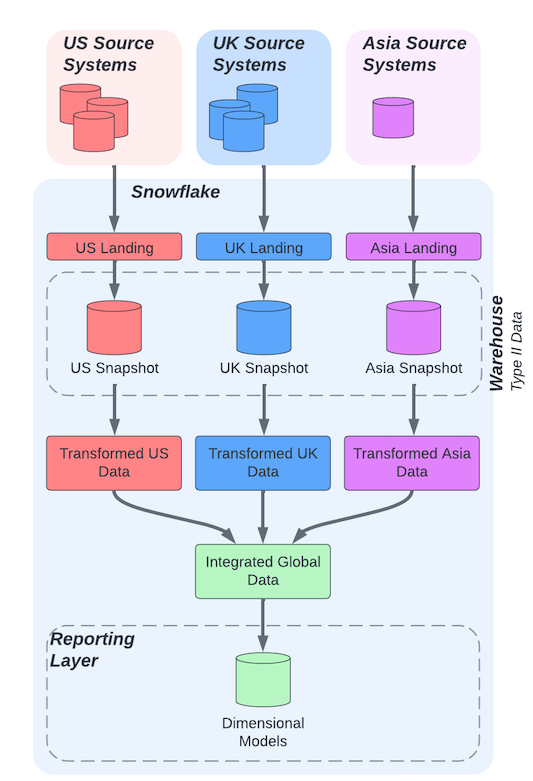
Each source system can have different transformations applied to conform to the different ERP systems (what data is and isn’t available and what format it’s in) and the different business processes (how the system has been used).
The differences between the different sites have been acknowledged and dealt with. The benefit is that a conformed global view across all sites has still been produced.
Different Definitions
The Challenge
There can be differences in definitions across the sites, or even between departments.
For a metric as simple as measuring work completed on time, “on-time delivery”, there may be different start times and end times. The timeliness may be measured against a defined end date, an end date calculated as an SLA from the start date, or as a measure of the duration, which may or may not include different types of hold period. All these various combinations of timeliness measures may be referred to using the same “on-time delivery” name.
The Solution
Working with different definitions for similar terms comes down to governance rather than technology.
In the case of the “On Time Delivery” metric, it’s vital to understand that each combination of start and end date, duration and the effect of hold periods and the comparison date. These are, in fact, different metrics – they are not all the same single metric. Each combination may have business value to someone and be a requirement in reporting. They can all be included, but they must be separated and the definition of each made clear.
As a part of the analytics and reporting platform, a data dictionary has been produced. It lists each field in the dimensional models and each metric in a Power BI data set. This has been made available as its own data set with Power BI dashboard. This means anyone querying a metric, or an attribute can easily find out what it represents. They can see where the data has been sourced from and what transformations it’s undergone.
Time Zone considerations for a global analytics and reporting platform
Being a global organisation, time zones present a problem. Not only in finding the right time to collaborate but also in presenting global data.
There is much to say about the difficulties of working with time zones. In the world of analytics and reporting, reporting on data as of now (the current moment) is simple enough. You can get the latest version of the data, and report on it. But when dealing with Type II data and needing to report on past points in time, across time zones, things get a bit more complicated.
Take, for instance, the ubiquitous reporting requirement: month-end reporting. At the end of each month, the business requires a view of what was done in the previous month. So, for a view of April, build the fact table with data as of YYYY-05-01 00:00:00.000000000. But which YYYY-05-01 00:00:00.000000000? At midnight on 1st May in New York, it’s only 9 PM in Los Angeles and there’re still invoices being approved to be included in month-end reporting. Meanwhile, over in London, it’s 5 AM and further afield in Singapore it’s midday and business has been continuing as normal into April.
The Solution
The answer is of course to build the fact table as of each YYYY-05-01 00:00:00.000000000 and collate them.
When data is landed into the datalake from the source systems and stored as Type II data, the related metadata (when the data was landed, when the data is effective from and until) has been stored with a consistent time zone (UTC). For each system in each time zone, we’re able to build the fact table with the data that was valid at the correct midnight. YYYY-05-01 00:00:00 in London is YYYY-04-30 23:00:00 UTC whereas YYYY-05-01 00:00:00 in New York is YYYY-05-01 04:00:00 UTC.
| Local Timestamp | Location | TimeZone | UTC Timestamp |
|---|---|---|---|
| 2022-05-01 00:00:00 | Los Angeles | -0700 | 2022-05-01 07:00:00 +0000 |
| 2022-05-01 00:00:00 | New York | -0400 | 2022-05-01 04:00:00 +0000 |
| 2022-05-01 00:00:00 | London | +0100 | 2022-04-30 23:00:00 +0000 |
| 2022-05-01 00:00:00 | Sinagpore | +0800 | 2022-04-30 16:00:00 +0000 |
The business data, e.g., when something was invoiced, is reported without a time zone. This allows our client to report on a particular day, knowing that anything that happened, happened on that day. For example, anything that happened on Wednesday in Los Angeles is reported against anything that happened on that same Wednesday in Singapore.
This approach allows month-end reporting to be generated for the month-end in each region accurately and reported on globally with each region’s previous month compared without any compromises in the data collection window.
Implementing a Global Analytics and Reporting Platform: Conclusion
By overcoming these challenges, we’ve been able to aid our clients in developing a global analytics and reporting platform. The platform offers great flexibility in handling technological and business-related differences seen between their various sites, producing a consistent global view.
If you want to understand how synvert TCM can help you get the most from your global data, then get in touch with us.